Fig. 5
From: High-resolution transcriptomics informs glial pathology in human temporal lobe epilepsy
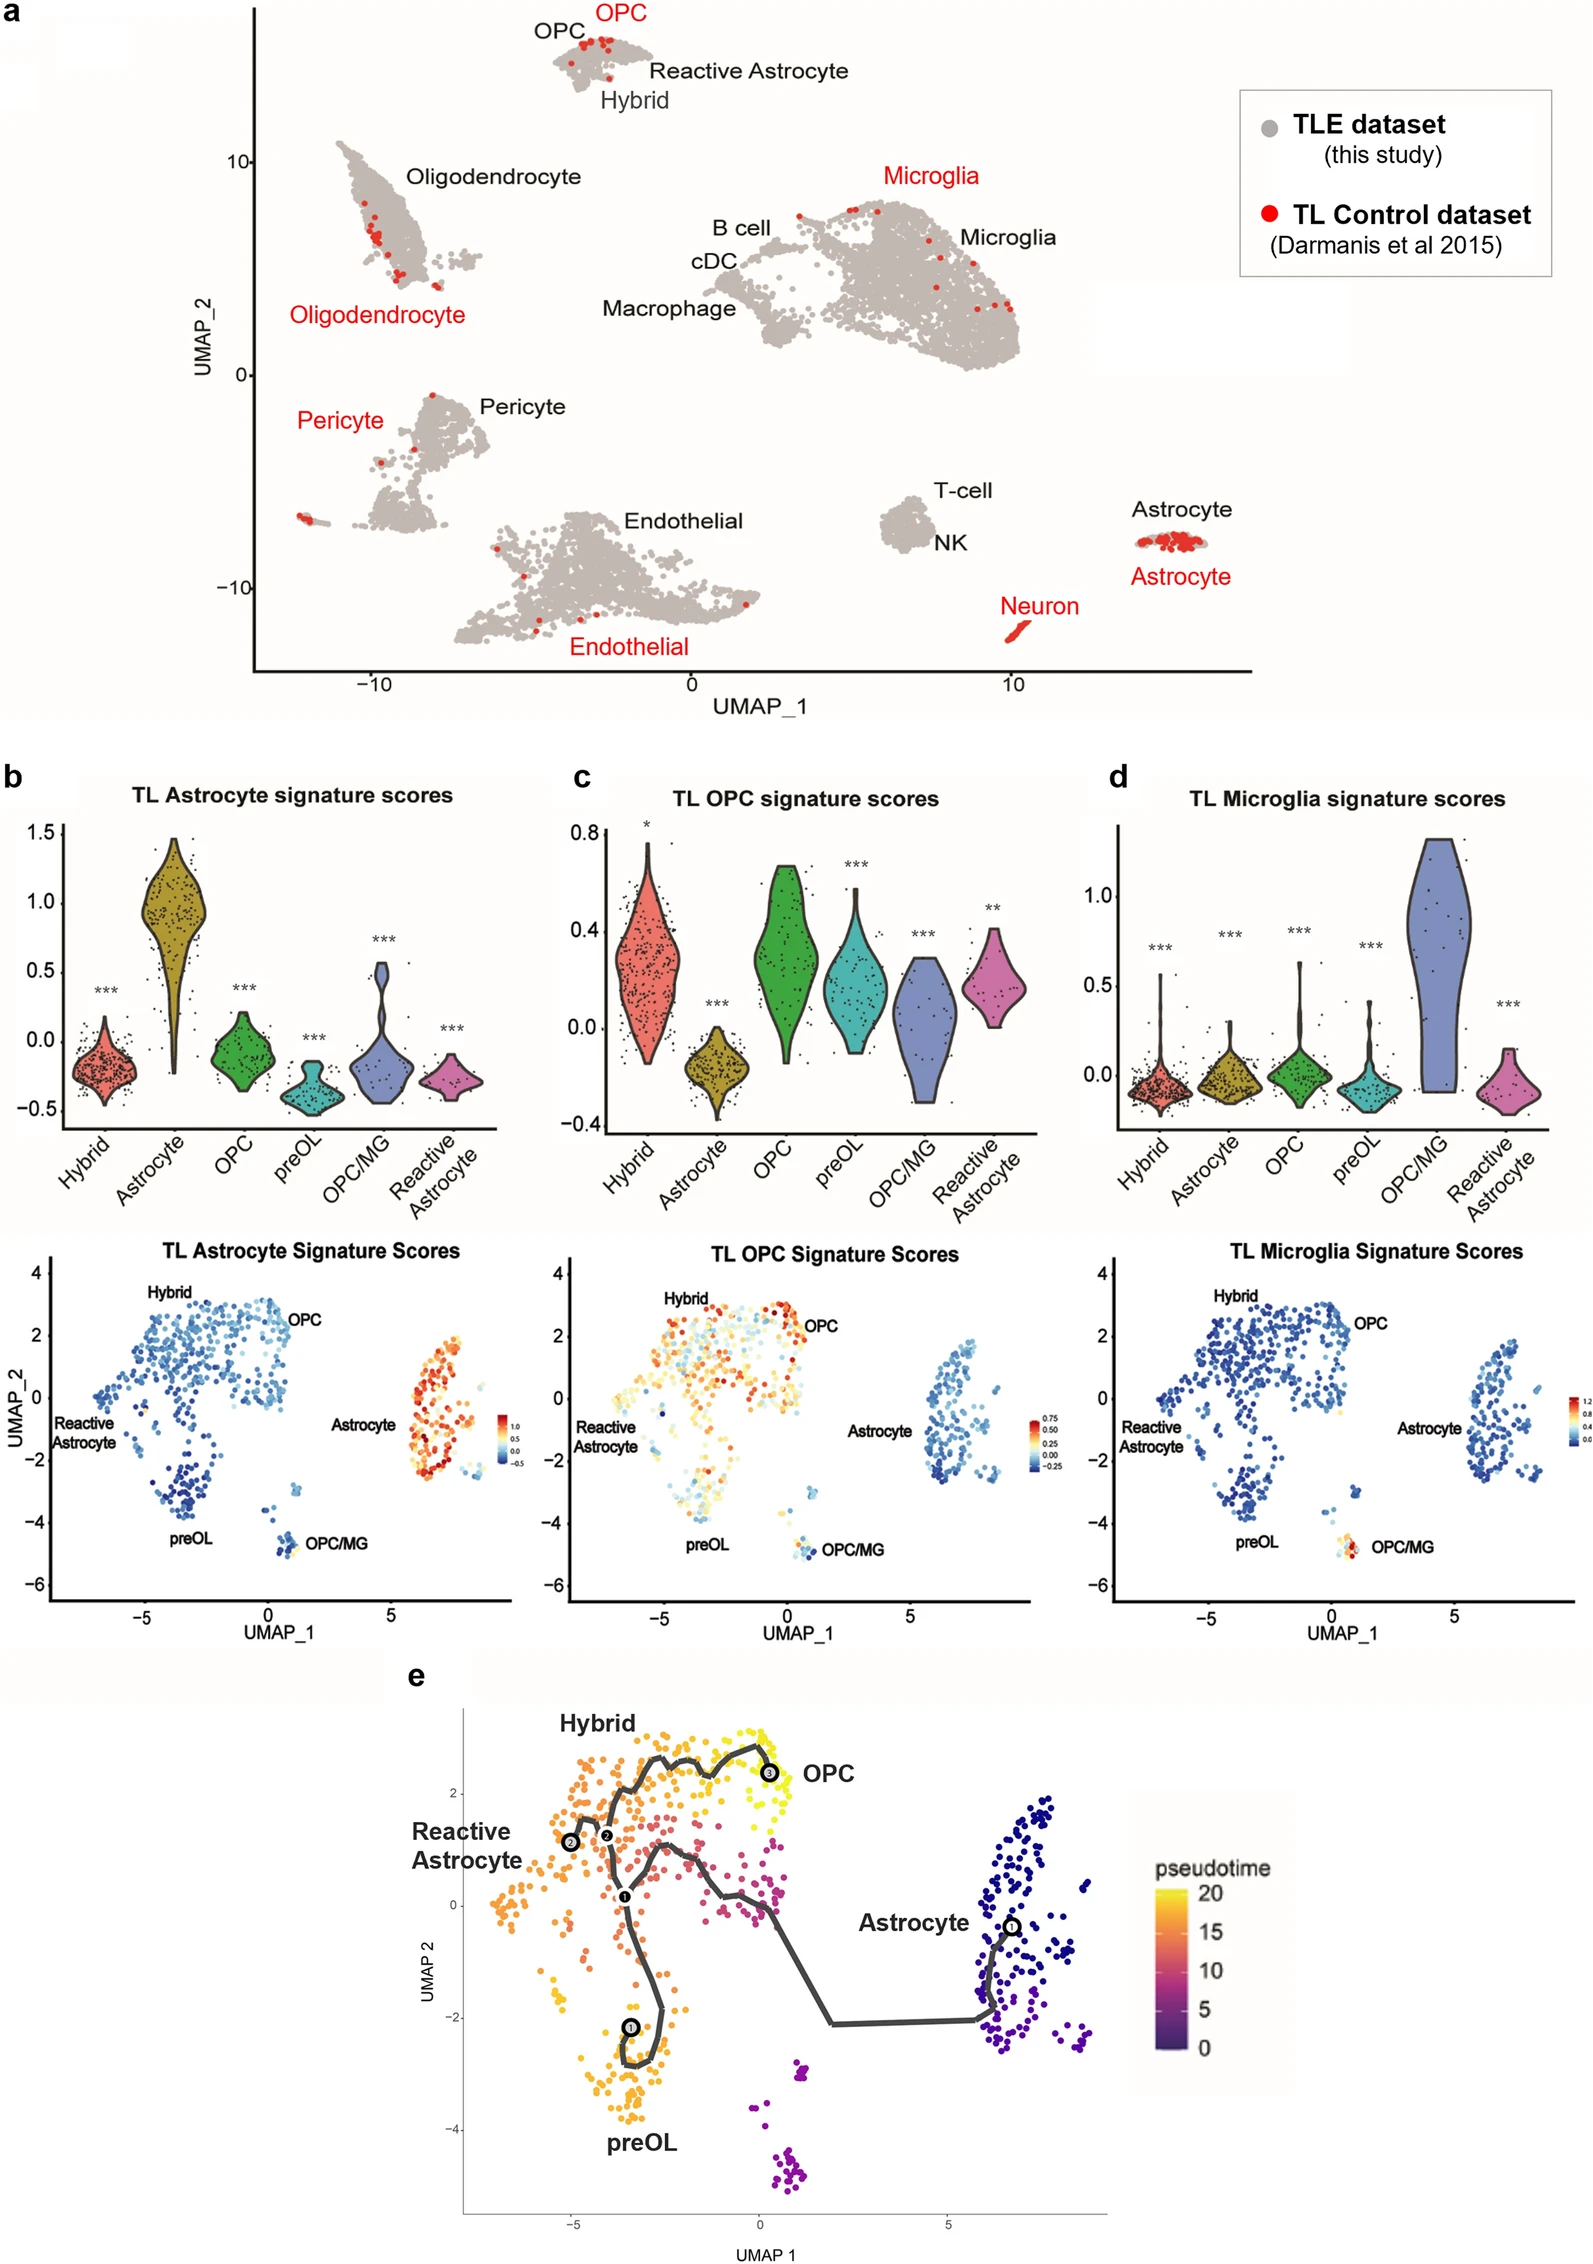
Comparison of normal and epilepsy temporal lobe scRNA-seq datasets confirms aberrant glial phenotypes. (a) UMAP representation of TLE data from Fig. 4a integrated with normal TL single-cell RNAseq data from Darmanis et al., PNAS 2015 [39]. Normal TL is denoted in red and TLE in gray. (b-d) Violin plots (top) and scaled gradient feature plots (bottom) representing projections of normal “TL astrocyte” (b), normal “TL OPC” (c) and normal “TL microglia'' (d) signature scores onto the diseased TLE astrocyte and OPC subclustered dataset in Fig. 4b, depicting abnormal enrichment of OPC-like signatures in TLE hybrid glia and reactive astrocytes (* = p-adj. < 0.05; ** = p-adj. < 0.005; *** = p-adj. < 0.0005 using Wilcoxon rank test, with Benjamini Hochberg correction for multiple hypothesis testing). (e) UMAP representation of Monocle3 pseudotime lineage trajectory analysis of TLE subclustered glia shown with astrocyte as the root cluster, depicting greater pseudotime similarity between OPCs, hybrid glia, and reactive astrocytes compared to astrocytes. See also Additional file 10: Fig. S4