Fig. 4
From: High-resolution transcriptomics informs glial pathology in human temporal lobe epilepsy
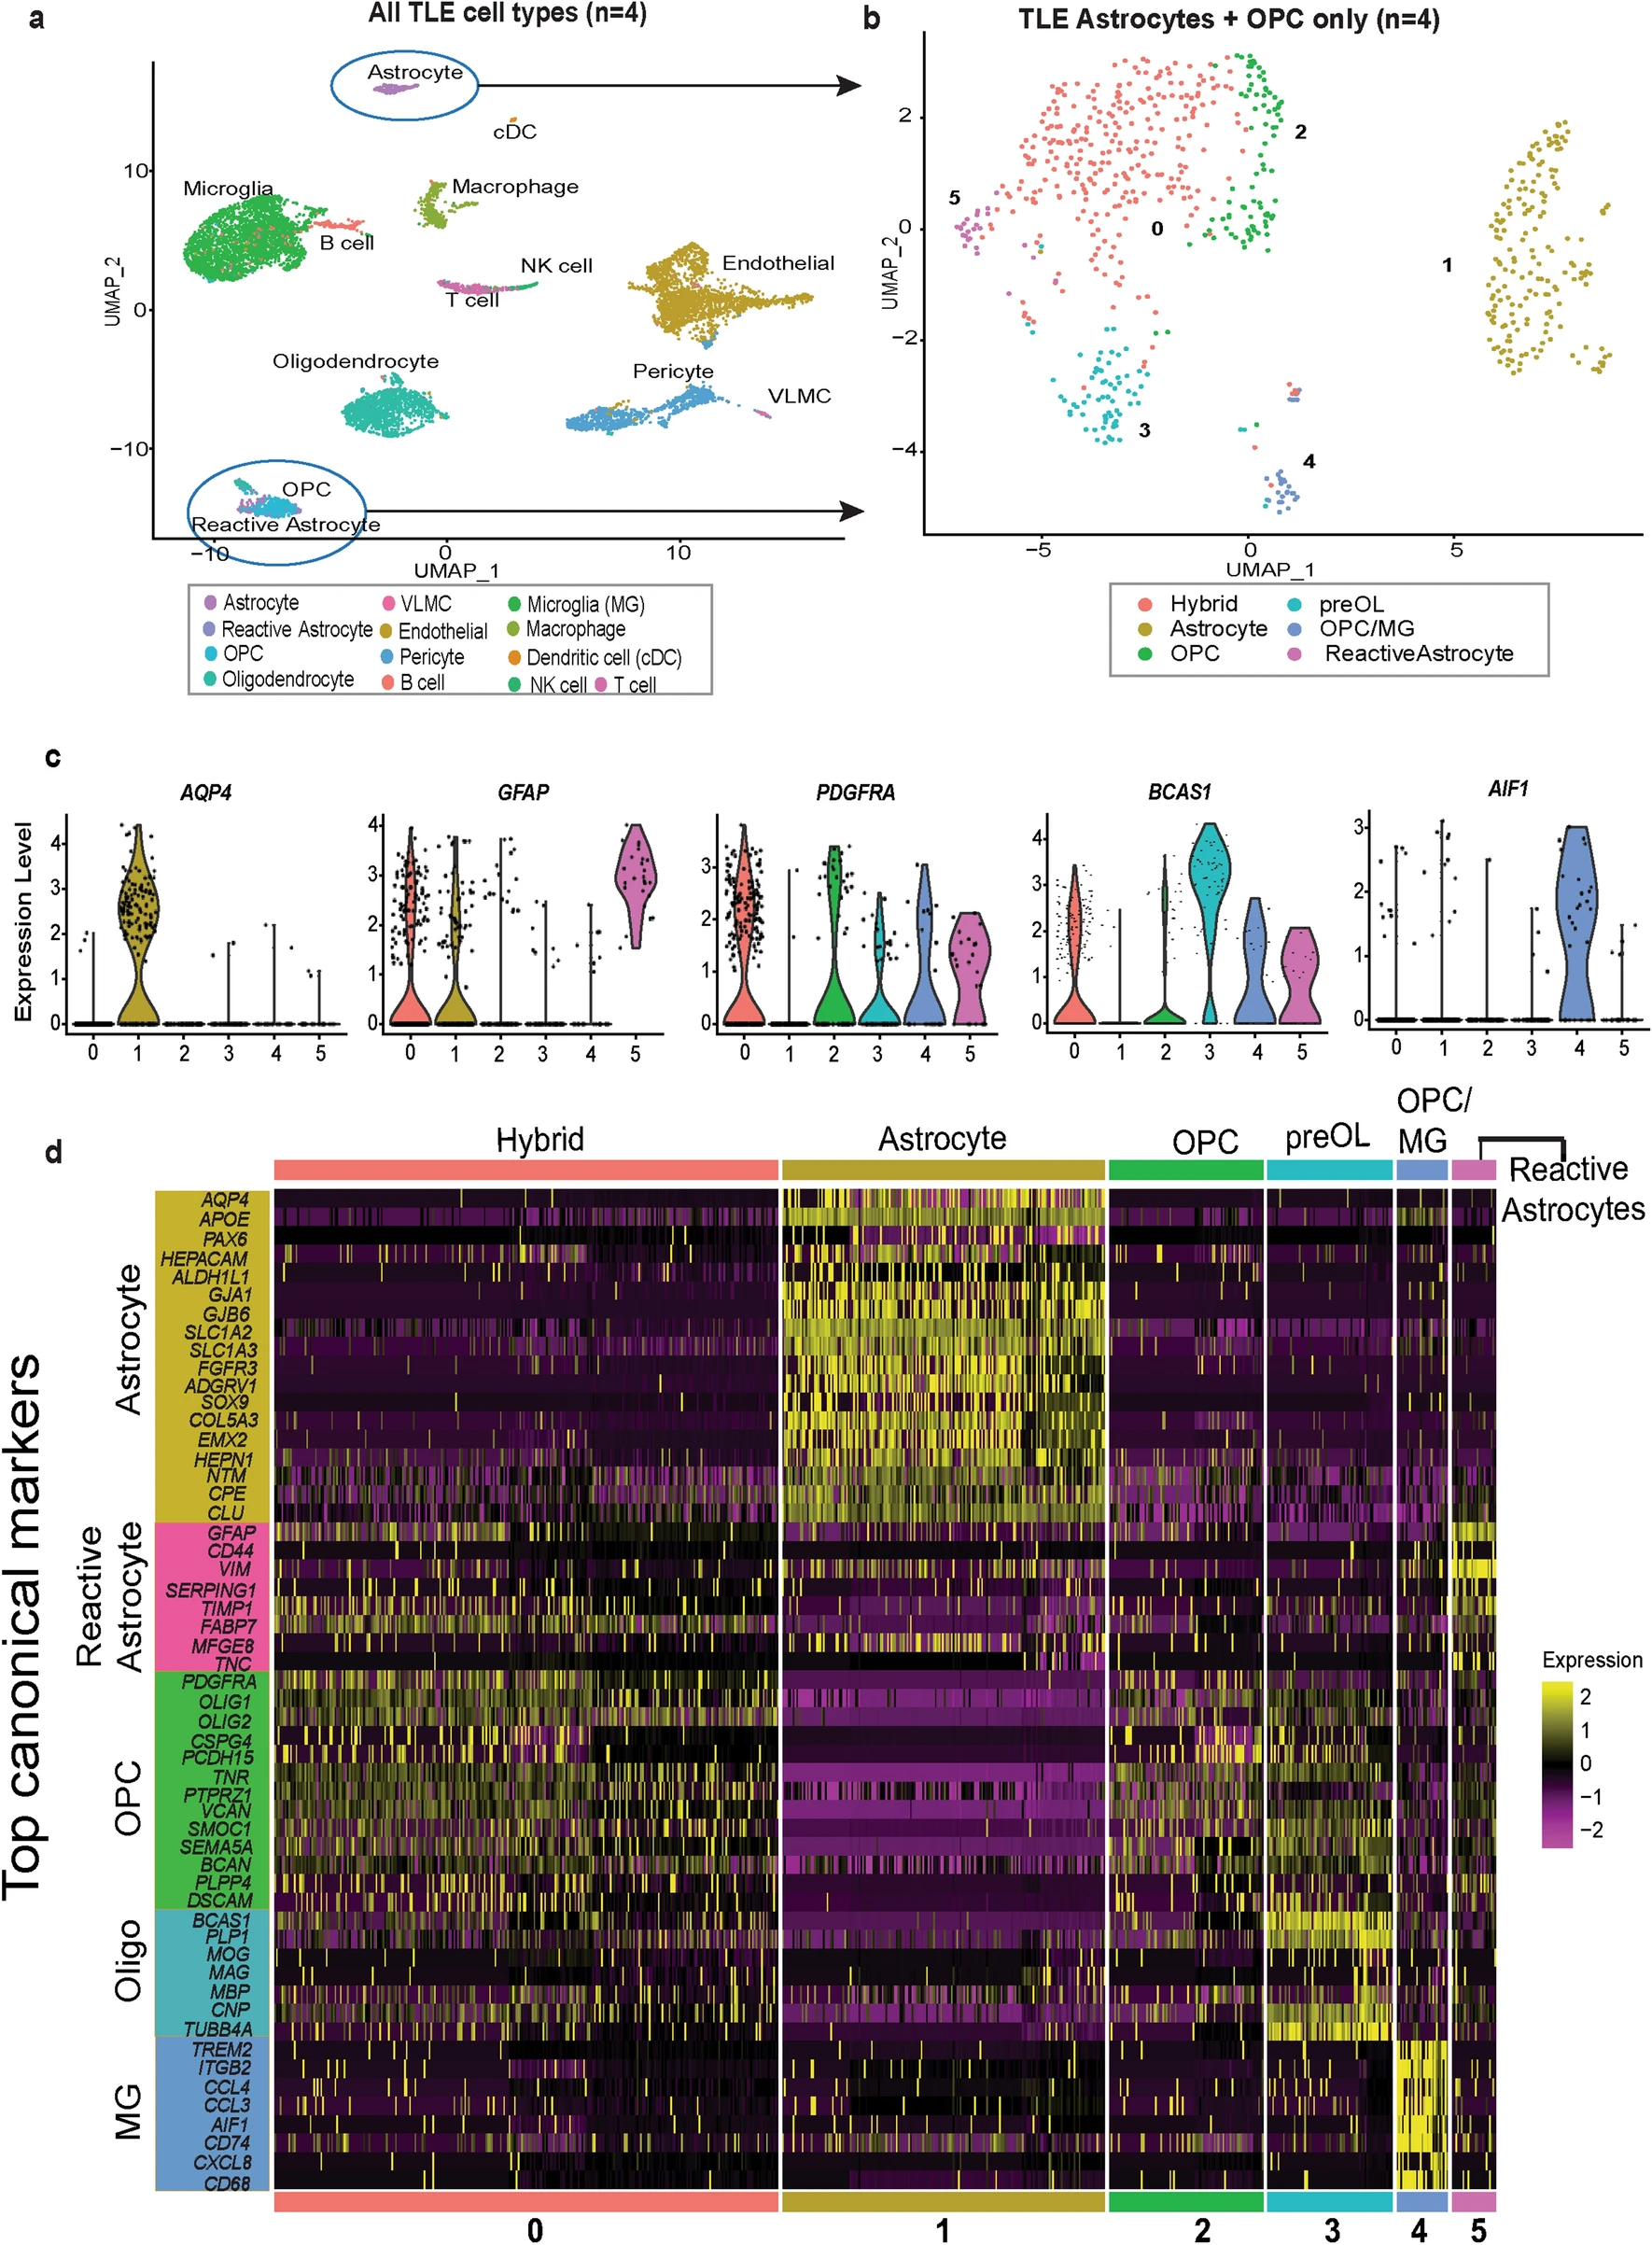
Single-cell transcriptomics of human temporal lobe epilepsy reveals mixed lineage glial subpopulations. (a) Uniform Manifold Approximation and Projection (UMAP) plot for integrated TLE samples from four different patients (14431, 13059, 19619, and 20188; see Table1). Clusters are colored by annotated cell types and indicated by labels. See also Additional file 7: Fig. S2a. (b) UMAP plot of subclustered astrocyte and OPC subpopulations from (a) after reclustering. Glial subpopulations cluster in six distinct clusters (0–5), colored by cluster ID. (c) Violin plots of log-normalized gene expression for canonical cell type-specific glial markers across the six subclusters identified in (b): AQP4 (Astrocyte), GFAP (Reactive astrocyte), PDGFRA (OPC), BCAS1 (premyelinating oligodendrocyte) and AIF1 (Microglia). Hybrid cluster 0 shows elevated expression of both PDGFRA and GFAP. (d) Heatmap of log-normalized and z-scored gene expression data from the subclustered TLE glia object, plotting canonical cell-type lineage markers for Astrocytes, Reactive astrocytes, OPC, Oligodendrocytes (Oligo), and microglia (MG) across glial subclusters 0–5, highlighting dual OPC/reactive astrocyte signatures in hybrid cluster 0. See also Additional file 7: Fig. S2b (same analysis plotting top 10 differentially expressed genes per cluster)